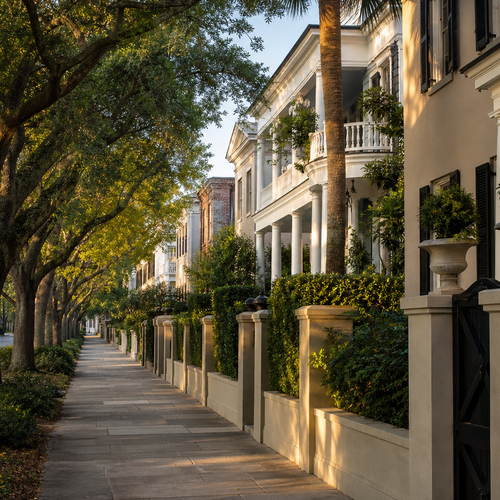

How to Price a Charleston House to Sell Fast in 2026
Price a Charleston home by anchoring to recent comparable sales, accounting for your submarket's days on market, and respecting search-filter psychology. Per Charleston Trident MLS data for July 2026, countywide sale-to-list ratios are running in the mid-to-high 90s, and overpricing by even a small margin risks a prolonged listing and forced price cuts that net you less.
How do you price a Charleston house to sell fast without leaving money on the table?
Pricing a Charleston home correctly means anchoring your list price to recent comparable sales in your specific submarket, understanding that countywide sale-to-list ratios are running in the mid-to-high 90s, and respecting how buyers filter searches by price band. Homes priced at or near what buyers are actually paying tend to generate the most activity in the first two to three weeks. Overpricing, even modestly, in slower-moving pockets like the 29403 zip code means fewer showings and, if you have to correct course later, a listing history that signals distress to the next wave of buyers.
What the Data Actually Says About Charleston Pricing Right Now
Before you pick a number, you need to understand what the market is telling you. Here is exactly what this section is built on: closed residential sales in Charleston County, Berkeley County, and Dorchester County, South Carolina, pulled directly from Charleston Trident MLS for July 2026, the most recent complete month. Charleston Trident MLS reports single family detached homes, single family attached homes (townhomes), and condominiums together under one Residential category, so these figures include all three, and they include both resale and new construction sales. In Charleston County specifically, single family detached homes made up roughly 70% of that month's closed volume, single family attached homes about 22%, and condominiums about 8%, so the countywide number below is overwhelmingly a house number, not a condo number.
In Charleston County, the median sold price in July 2026 was $631,000, with homes closing at 97.7% of their final list price on average. That 97.7% figure is the one most public reports quote, but it only measures the gap from your final asking price, after any price cuts. The number that actually matters when you are deciding what to list at is the sale-to-original-list-price ratio: 95.6% in Charleston County. That is the real cost of getting the first number wrong.
What 95.6% means in plain terms: the average seller who has to negotiate or reduce ends up closing about 4.4% below their original ask. On a $631,000 home, that is roughly $27,800. Price $30,000 or more above what the comps support and you are not negotiating from strength, you are pre-loading that same gap and adding weeks of extra time on market to get there.
| County | Median Sold Price | Avg. Days on Market | Sale-to-List Ratio |
|---|---|---|---|
| Charleston | $631,000 | 44.5 | 97.7% |
| Berkeley | $405,265 | 42.3 | 99.0% |
| Dorchester | $400,000 | 44.6 | 98.9% |
All three counties sell in a similar window, in the low-to-mid 40s for average days on market, but Berkeley and Dorchester are both closing tighter to their final list price than Charleston County. That is worth knowing if you are weighing a move within the Tri-County area as much as if you are just pricing a sale.
Public reports from real estate portals and local media add useful context for understanding buyer psychology, even though most of them do not publish the exact county, property type, or date range behind their numbers, so treat them as directional, not a substitute for a local market analysis. One example worth flagging directly: a widely shared July 2026 report from Charleston Housing News cited a $512,000 median sale price for Charleston County, well below the $631,000 verified directly against Charleston Trident MLS above. That gap is large enough that it should not be used to set a list price. Zillow's Charleston market page, reflecting data through June 30, 2026, shows a median sale-to-list ratio of 0.974, in the same range as the MLS figures above. Redfin's Charleston housing market overview, updated in late August 2026, reports homes selling in about 65 days on average, noticeably higher than the MLS number, likely reflecting a wider geography than Charleston County alone.
Here is where the Tri-County area's five submarkets I work in most stand, per the same Charleston Trident MLS pull for July 2026:
| Area | Median Sale Price | Average Days on Market |
|---|---|---|
| Mount Pleasant | $920,000 | 37.8 |
| West Ashley | $480,000 | 43.0 |
| North Charleston | $345,000 | 42.2 |
| Summerville | $410,000 | 44.1 |
| Goose Creek | $309,995 | 52.3 |
Goose Creek is the slowest of the five at 52.3 days, and Mount Pleasant is the fastest at 37.8, a real 15-day spread, but it is a narrower gap than it might look on a quick scan. Every one of these five submarkets is selling within a few weeks of the county average. That is genuinely useful to know: it means the pricing conversation should be about your specific comps and condition first, submarket timing second. Goose Creek sellers should still expect a longer runway and price accordingly, but nothing here supports treating any one of these five areas as dramatically faster or slower than the rest.
List-Price Psychology: How Buyers Search and What That Means for Your Number
Buyers on Zillow, Redfin, and Realtor.com filter by price bands. That is not a small detail. It determines whether your listing appears in a search at all.
A home priced at $599,000 shows up in every buyer searching up to $600,000. A home priced at $605,000 disappears from that entire pool. In a market where more inventory and sub-100% sale-to-list ratios are giving buyers real leverage, losing visibility in a price band can cost you weeks of activity and potentially force the price cut you were trying to avoid.
The practical question is not just "what is my home worth" but "what price band captures the most qualified buyers for a home like mine." Those are related but not identical questions, and the difference between them is where a lot of sellers leave money on the table, or worse, leave their home sitting.
Pricing slightly below market: when it makes sense
In specific micro-markets that still have strong demand and limited supply, pricing just below recent comparable sales can pull in more showings in the first week and create the conditions for multiple offers. The goal is not to give your home away. It is to generate competition that drives the final price up organically. This strategy works best when buyer demand in your specific price band outpaces available inventory. It does not work in a submarket where buyers have several months of options sitting in front of them.
Pricing at or slightly above market: when it is defensible
If your home has meaningful upgrades, a premium lot, or a feature set that recent comps do not reflect, pricing slightly above the median can be justified. The key word is "slightly." With countywide sale-to-list ratios in the mid-to-high 90s, the market is already telling you that buyers expect some negotiation room. Pricing 5% to 8% above comparable sales does not give you negotiating room. It gives buyers a reason to skip your listing entirely and wait for something more reasonably priced.
I walk every seller through this math before we settle on a number, because the gap between what feels right and what the data supports is where most pricing mistakes live. If you want to see how overpricing plays out in real costs, this post on what overpricing your Charleston home really costs in 2026 breaks it down in detail.
Slower-Moving Pockets and When to Cut the Price
The 29403 zip code, the North of Calhoun corridor in downtown Charleston, is a useful example of a submarket that needs a different pricing conversation, not because it is dramatically slower, but because it runs more inventory and more negotiating room than the county overall. Per Charleston Trident MLS data for July 2026, 29403 posted a median sold price of $970,000, well above the countywide $631,000, with about 3.9 months of absorption against 3.6 countywide, and sellers there closed at 93.2% of their original list price versus 95.6% countywide. Average days on market, 45.8, is close to the county's 44.5, so homes there are not sitting dramatically longer, but the wider gap between original ask and final sale price tells you buyers in 29403 have real room to negotiate.
Here is the two-phase approach I use with sellers in markets like this:
Phase 1 (weeks one through three): List at a price that is defensible against recent comparable sales. Watch showing traffic, online engagement (views and saves on portals), and any written feedback from buyer agents. If you are getting consistent showings but no offers, the price may be close but the home has a presentation or condition issue. If you are getting almost no showings, the price is the problem.
Phase 2 (after 21 to 30 days with weak activity): A modest, decisive price reduction that moves you into alignment with where buyers have actually been closing. A small, tentative cut of 1% rarely moves the needle. A meaningful adjustment that repositions your home in a more active price band does. The Realtor.com Charleston market data from 2025 showed typical sale prices running about 2.33% below list, a figure that is not independently verified against this post's MLS data but is directionally consistent with it. A price reduction that gets you to where buyers are actually transacting is not a loss. It is a correction that gets you back in the game.
The decision to reduce should be driven by data, not emotion and not arbitrary timelines. But if you are sitting at 30 days with fewer than five showings and no offers in a market where the county average is 44.5 days, that is the market telling you something. Waiting another 30 days without adjusting rarely produces a different result. It usually produces a second price cut and a listing history that buyers treat as a red flag.
For a deeper look at the specific mistakes that extend days on market, this post on the three pricing mistakes killing Charleston home sales is worth reading before you set your number.
Your specific price depends on your home's condition, location, flood zone, school zoning, and what has actually closed in your immediate area in the last 60 to 90 days. That is where a local market analysis from someone who works these streets every day makes the difference between a price that generates offers and one that generates silence.
Frequently Asked Questions
What is the typical sale-to-list price ratio in Charleston right now?
Per Charleston Trident MLS data for closed residential sales in Charleston County in July 2026 (the most recent complete month), homes sold at 97.7% of their final list price on average, and 95.6% of their original list price, the number that captures any price cuts along the way. Berkeley County closed at 99.0% of final list (97.2% of original), and Dorchester County closed at 98.9% of final list (96.1% of original). All three counties are running in the mid-to-high 90s, but Berkeley and Dorchester are consistently a point or two tighter than Charleston County.
Is it smarter to price my Charleston house slightly below market to get multiple offers?
It depends on your submarket. In areas with strong demand and limited inventory, pricing just below recent comparable sales can generate early showing traffic and competing offers that push the final price up. In slower-moving pockets with more months of inventory, that strategy is less reliable because buyers have enough options that they are less likely to compete aggressively. A local market analysis will tell you which situation you are in before you commit to a number.
How long are homes taking to sell in Charleston County right now?
Charleston Trident MLS data for closed residential sales in Charleston County in July 2026 shows an average of 44.5 days on market (56.9 cumulative days on market, which counts relisted time). Berkeley County averaged 42.3 days and Dorchester County averaged 44.6 days over the same month. Submarkets vary: Mount Pleasant averaged 37.8 days, West Ashley 43.0, North Charleston 42.2, Summerville 44.1, and Goose Creek 52.3, so your local number matters more than the county headline.
When should a Charleston seller do a price reduction, and how much should they drop?
If you have fewer than five showings in the first 21 to 30 days and no offers, the price is almost certainly the issue. A meaningful reduction that repositions your home in a more active price band (not a token 0.5% cut) is more effective than waiting. The goal is to align your asking price with where buyers in your area have actually been closing, which Charleston Trident MLS data puts in the mid-to-high 90s as a percentage of list across all three counties. Your agent should be reviewing showing traffic and online engagement data with you regularly rather than waiting for an arbitrary deadline.
How does the 29403 zip code compare to the rest of Charleston County?
The 29403 zip code, North of Calhoun in downtown Charleston, is a high-value pocket, with a July 2026 median sold price of $970,000 against a countywide median of $631,000. It also runs a bit more inventory than the county overall (about 3.9 months of absorption versus 3.6 countywide), and sellers there are settling for more distance from their original asking price (93.2% of original list versus 95.6% countywide). Average days on market, 45.8, is close to the county average, so 29403 is not dramatically slower to sell. It is a market where buyers have a bit more room to negotiate and sellers need to price closer to the comps from the start.
Pricing a Charleston home well is one of the most consequential decisions in the entire selling process. Get it right and you generate early momentum, qualified buyers, and a clean negotiation. Get it wrong and you feed a listing history that buyers use against you.
I walk sellers through this exact math, pulled straight from the MLS, on every listing consultation. If you want a market analysis specific to your address and a straight conversation about what your home should be priced at, reach out and let's talk.
About Brett Kelley
Brett Kelley is the team leader of The TREAT Team in Charleston, SC. Leading a team of experienced advisors, Brett has personally closed more than 300 homes and helps buyers, sellers, and investors across the Charleston, Berkeley, and Dorchester County tri-county area with an honest, client-first approach.
SCSOLD, LLC · 843.738.2394
Equal Housing Opportunity. Brett Kelley, The TREAT Team, SCSOLD, LLC. South Carolina Real Estate Commission License #96167. This article is general information only and is not legal, tax, or financial advice. Confirm your specific numbers with your closing agent, tax advisor, or lender before setting a list price.